

— WHY JORDAN
A compound advantage that no single competitor can replicate.
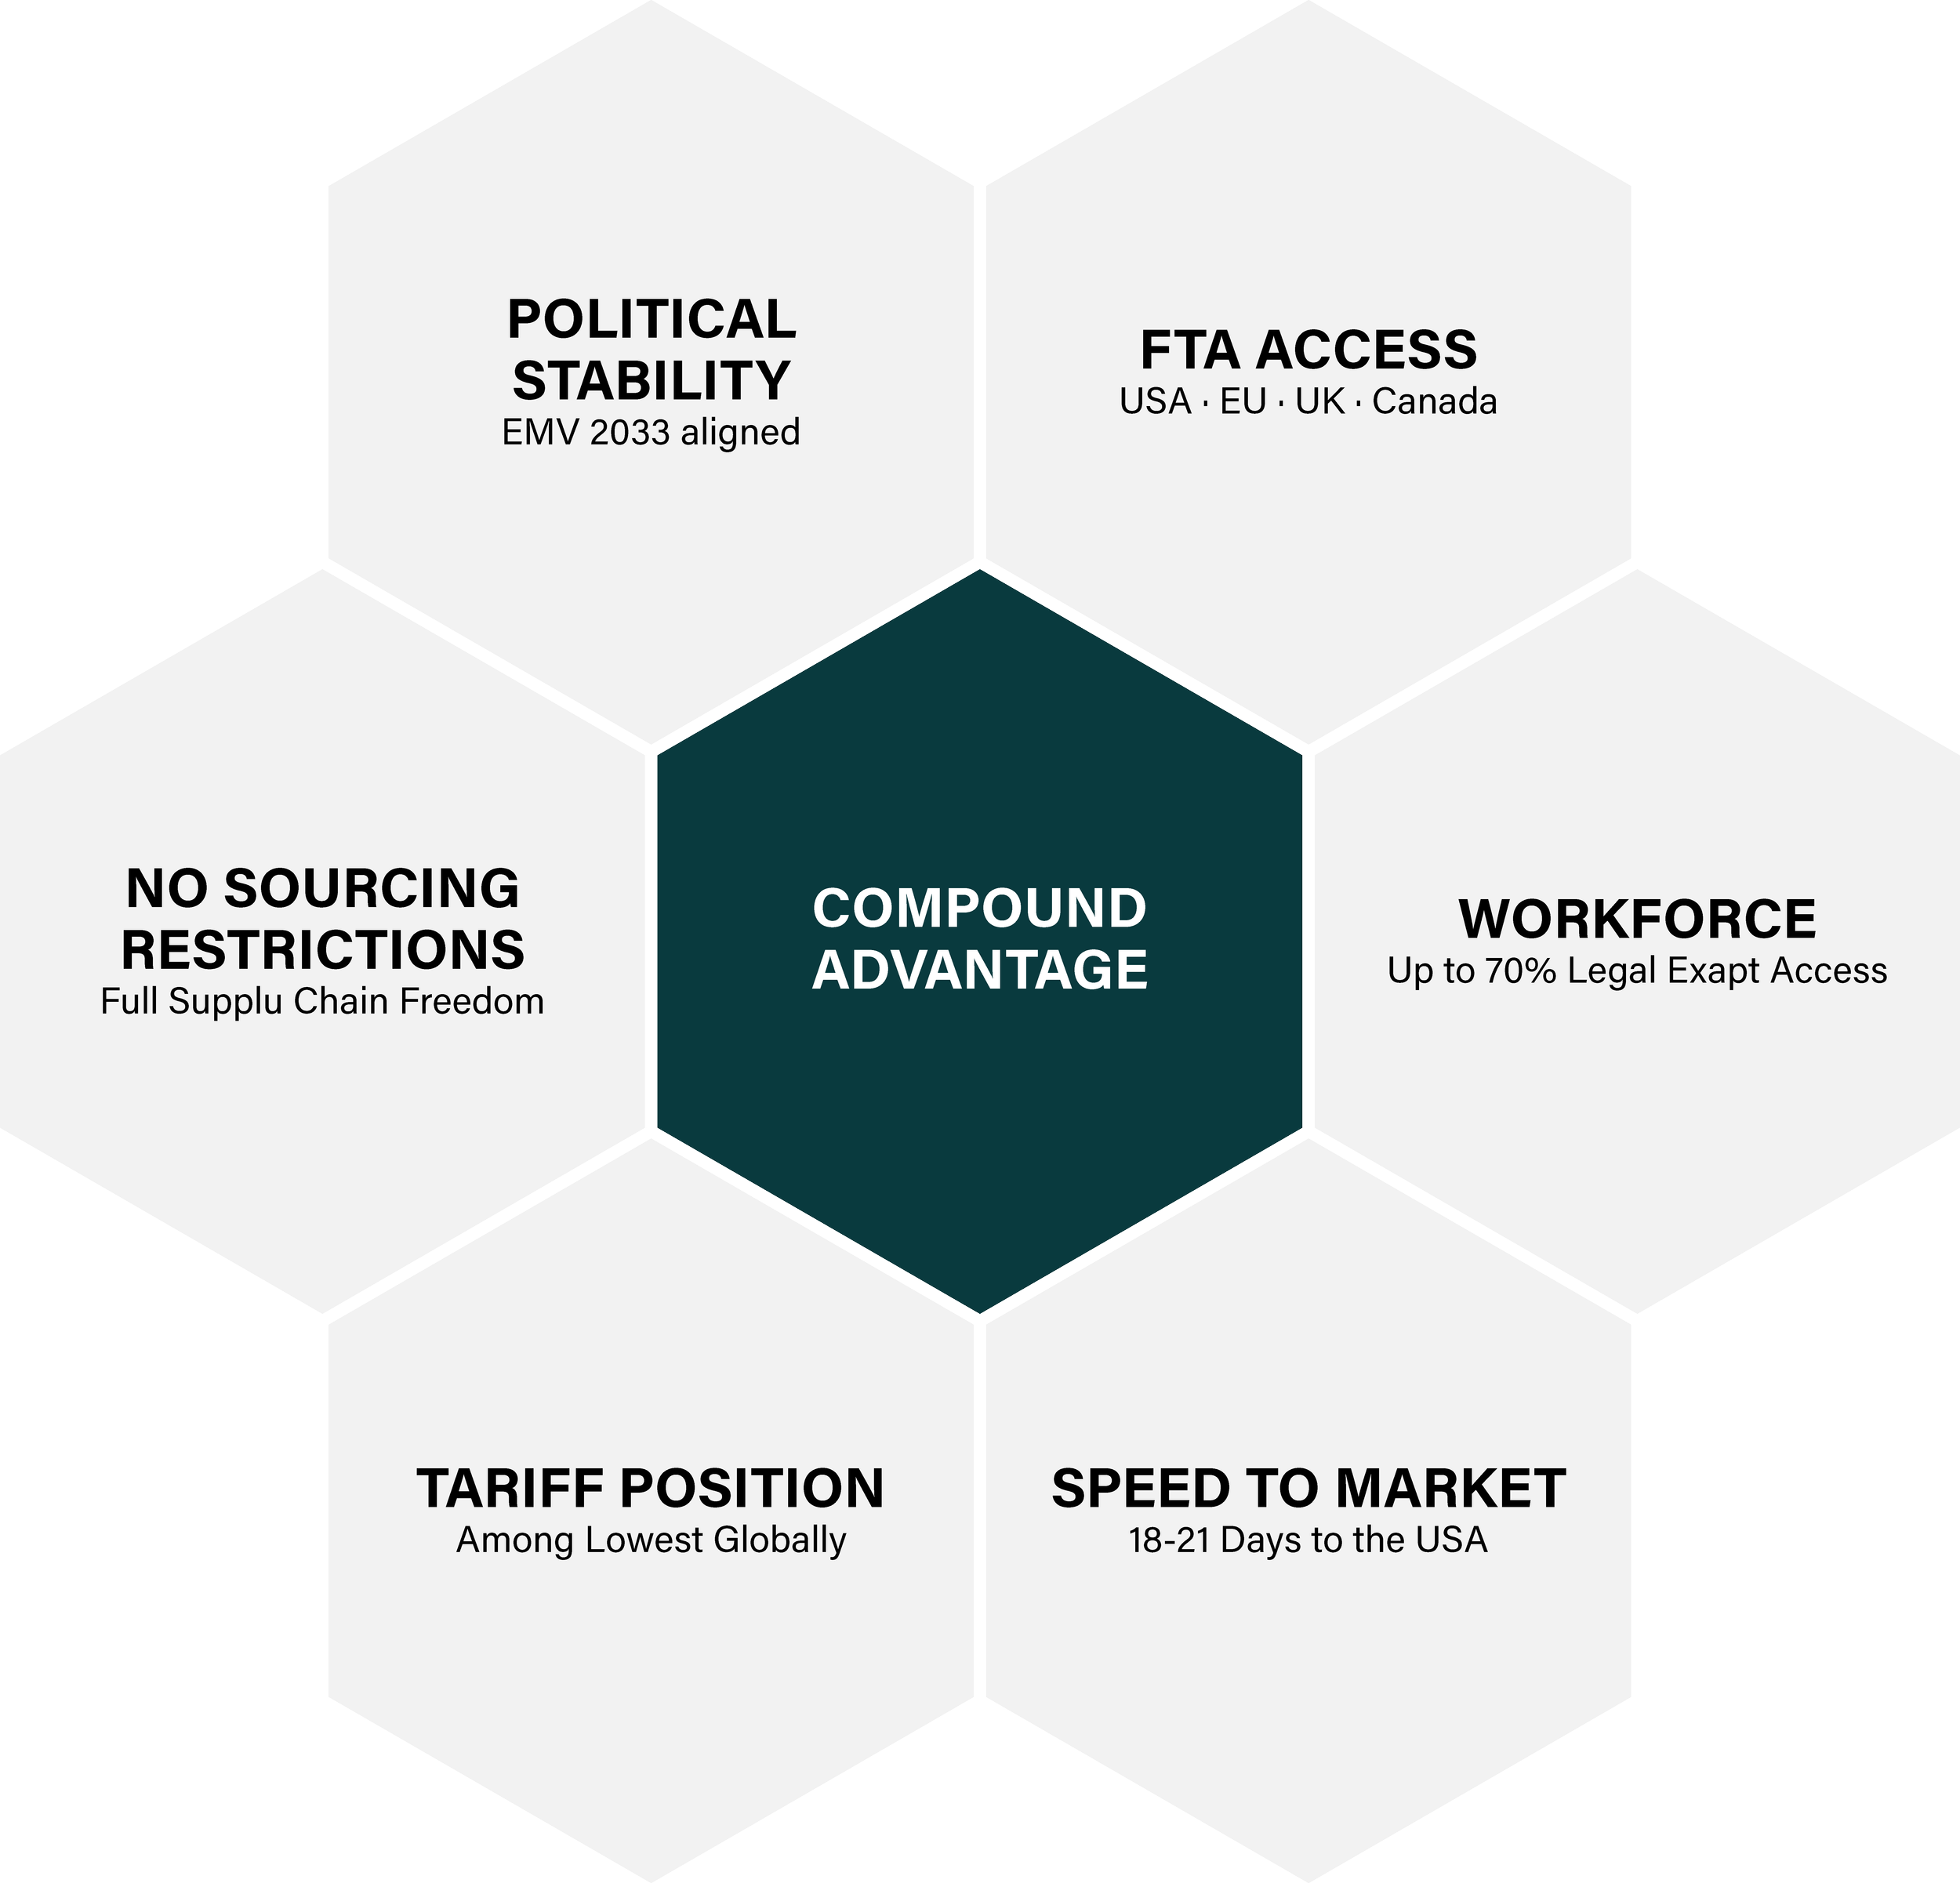
No single factor wins this argument. Legal expat workforce access, preferential trade agreements, improving tariff position, and centralized utility savings (stacked together) create a structural advantage that outperforms any comparable manufacturing hub for the apparel and fabric sector.
The combination of legal access to highly efficient and experienced expat workforce, open-source manufacturing excellence, preferential trade agreements, and centralized utility savings via the Smart Cluster makes Jordan the most cost-efficient and productive base for apparel manufacturing. This is a totality argument: no single factor wins the comparison alone. The compound effect is the value proposition.

— COMPOUND ADVANTAGES DOCUMENT SMART CLUSTER JORDAN
Six structural advantages. stacked.
— CORE COUNTRY ADVANTAGES
Unlike Egypt, which has no legal access to expat workers, Jordan's model stacks multiple structural advantages that reinforce each other. Each is significant alone. Together, they are decisive.

FTA ACCESS
USA · EU · UK · Canada
Preferential trade with all four major markets, including the double substantial transformation provision for US market access, a rare advantage unavailable to most competing nations. Fabric can originate abroad and still qualify for US duty-free access after being cut and sewn in Jordan.
WORKFORCE
Up to 70% Legal Expat Access
Jordan legally permits up to 70% expatriate workforce, providing flexible, cost-efficient access to skilled foreign labor. Jordan also has a large youth population (70%+) ensuring execution speed. Egypt has no legal pathway for equivalent expat access, a key structural disadvantage for scaling garment operations quickly.
SPEED TO MARKET
18–21 Days to the USA
Versus 40–50 days from the Far East, enabling up to 15 replenishment cycles per season versus 4–5. Fast fashion depends entirely on speed and replenishment cycles. Jordan's location delivers this structurally, not by exception.
TARIFF POSITION
Among the Lowest Globally
Current low tariff base with a clear path to 10% parity, outperforming tariff-exposed Far East manufacturing hubs where exposure is structurally higher and less predictable. $256B of Far East apparel capacity is currently tariff-exposed. Jordan is absorbing it.
EGYPT QIZ VS JORDAN FTA
No Sourcing Restrictions
Egypt's QIZ scheme requires manufacturers to source a minimum 11% of raw materials from Israel, a mandatory cost burden that limits supply chain flexibility and inflates input costs. Jordan imposes no such restriction. Full sourcing freedom, open FTA.
POLITICAL ENVIRONMENT
Stable, Business-Ready
Political stability, clean bureaucracy, enabling legal frameworks, and investor-friendly regulation. Aligned with Jordan Economic Modernization Vision 2033, a sovereign-backed industrial platform with national policy weight behind every decision.
— FREE TRADE AGREEMENT ACCESS
USA
Double Substantial Transformation, fabric from abroad qualifies for duty-free access after cut and sew in Jordan. Unavailable to most competitors.
European Union
Association Agreement with full tariff reductions. Access to 27 member state markets under preferential terms.
United Kingdom
Post-Brexit continuity agreement, preferential access maintained. Stable framework for long-term sourcing relationships.
Canada
Competitive tariff positioning under bilateral trade framework. Landed-cost calculations more stable than Far East alternatives.
25–50% utility savings, passed directly to tenants.
— UTILITY COST COMPARISON
Smart Cluster achieves reductions through centralized procurement, shared grid infrastructure, bulk supply agreements, and renewable integration. The aim is to reduce utility costs to become more competitive overall, the totality, not any single line item, is what makes Jordan optimal.
25%
ELECTRICITY SAVING VS. JORDAN STANDARD
Centralized procurement, shared grid infrastructure, renewable integration. Savings passed directly to tenants.
50%
WATER COST SAVING VS. JORDAN STANDARD
On a 20-tonne run: from $10,000 → $5,000. Plus saves ~$15M in STP/ETP plant capital expenditure.
34%
NATURAL GAS SAVING VS. JORDAN STANDARD
Terminal charges, pipeline network fees, and trucking costs absorbed through bulk supply agreements.
Calculate your utility saving.
— INTERACTIVE TOOL
Enter your production volume and current utility rates to see your indicative annual saving at Smart Cluster versus Jordan's standard market rate. Values are indicative, based on published rate comparisons.
Utility Cost Calculator: Select your operation type and enter your monthly production volume. The calculator applies Smart Cluster's centralized rates versus Jordan's standard market rates to show your projected annual savings across electricity, gas, and water.
All figures are indicative estimates based on published rate comparisons from the Smart Cluster Compound Advantages document. Actual savings depend on production mix, shift patterns, and energy intensity. Request the detailed financial model via the investor deck.

Jordan is under-scaled, not under-competitive.
— STRATEGIC POSITION
Jordan's apparel sector grew from $0.9B exports in 2009 to $2.4B in 2024. Apparel now accounts for approximately 8.1% of manufacturing GDP. This growth has been enabled by preferential trade agreements, political stability, and proven manufacturing reliability. The sector is now approaching a structural ceiling, not because demand or competitiveness has weakened, but because systemic constraints in the current fragmented industrial model prevent it from absorbing large-scale global demand. Smart Cluster resolves this at the infrastructure level.
A 3.9× scale-up enabled by Smart Cluster infrastructure
Apparel is the single largest manufacturing export sector
Structural proximity, not logistics optimisation
Jordan delivers this structurally.